I was looking for an easy way to measure my power usage and visualize it in a nice way. Using existing components in my setup and some cheap hardware I came up with something thats easy to build and reliable.
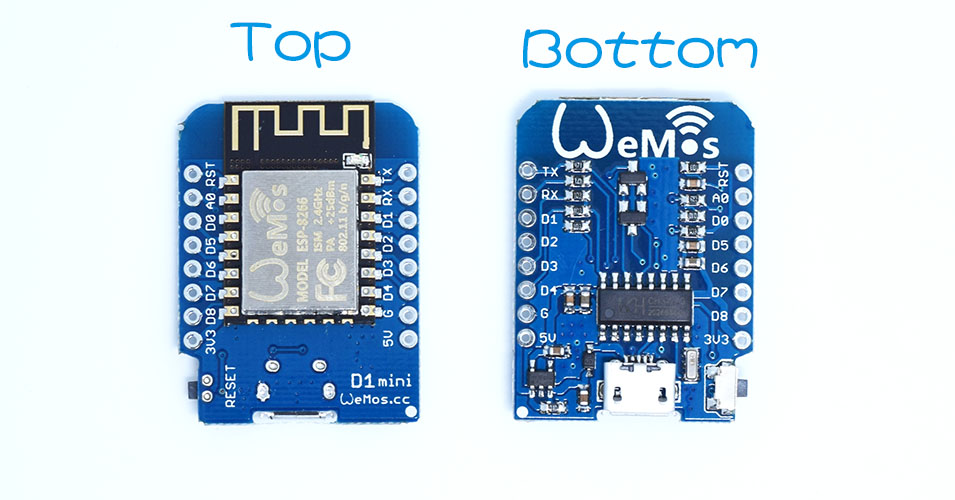
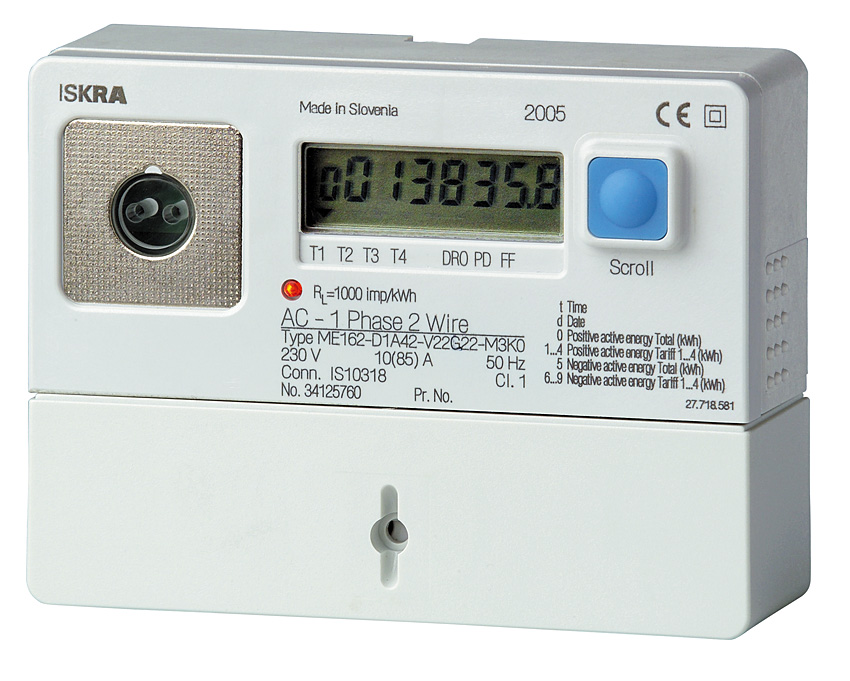
I am using an ESP8266-based board, the Wemos D1 Mini. If you’re not familiar with the ESP8266 line of products, in short it’s an Arduino with built-in WiFi for around USD 3. As you can see in the picture, I have connected it to an LDR and an MQTT message bus. The LDR measures the pulses coming from my utility company’s power meter and converts it to Watts usage. Then the data goes via an MQTT bus with some rewriting in Node-RED to an Elasticsearch server, which allows me to visualize the data using Kibana.



Wemos D1 Mini with LDR
The (WeMos D1 Mini)[http://www.wemos.cc/Products/d1_mini.html] is an ESP8266 breakout. It’s relatively small and cheap on AliExpress. I used the Arduino library to program the ESP8266 using Arduino-style code.
#include <Arduino.h>
#include <ESP8266WiFi.h>
#include <PubSubClient.h>
#include "DHT.h"
#include <TM1637Display.h>

#define DHTPIN D
#define DHTTYPE DHT11

#define SEGCLK 2
#define SEGDIO 3

const char* ssid = "xxx";
const char* password = "yyy";
const char* mqtt_server = "mqtt.int.mtak.nl";

const char* dhtTopic = "meterkast/dht";
const char* ldrTopic = "meterkast/power";

WiFiClient espClient;
PubSubClient client(espClient);
DHT dht(DHTPIN, DHTTYPE);
TM1637Display display(SEGCLK, SEGDIO);

long lastDht = 0;
char msg[50];
long lastLdrTime = 0;
long lastLdrUpdate = 0;
long lastDisplayUpdate = 0;
int lastDisplayState = 0;
int lastPower = 0;
int lastTemp = 0;

void setup() {
  pinMode(BUILTIN_LED, OUTPUT);     // Initialize the BUILTIN_LED pin as an output
  digitalWrite(BUILTIN_LED ,0);     // Turn LED on while starting

  uint8_t data[] = { 0xff, 0xff, 0xff, 0xff };
  display.setBrightness(0x0f);
  display.setSegments(data);

  Serial.begin(115200);
  setup_wifi();
  client.setServer(mqtt_server, 1883);
  client.setCallback(callback);

  dht.begin();
  digitalWrite(BUILTIN_LED ,HIGH);     // Turn LED off
}

void setup_wifi() {

  delay(10);
  // We start by connecting to a WiFi network
  Serial.println();
  Serial.print("Connecting to ");
  Serial.println(ssid);

  WiFi.begin(ssid, password);

  while (WiFi.status() != WL_CONNECTED) {
    delay(500);
    Serial.print(".");
  }

  Serial.println("");
  Serial.println("WiFi connected");
  Serial.println("IP address: ");
  Serial.println(WiFi.localIP());
}

void callback(char* topic, byte* payload, unsigned int length) {
  Serial.print("Message arrived [");
  Serial.print(topic);
  Serial.print("] ");
  for (int i = 0; i < length; i++) {
    Serial.print((char)payload[i]);
  }
  Serial.println();

}

void reconnect() {
  // Loop until we're reconnected
  while (!client.connected()) {
    Serial.print("Attempting MQTT connection...");
    // Attempt to connect
    if (client.connect("client_identifier", "mqtt_username", "mqtt_password")) {
      Serial.println("connected");
    } else {
      Serial.print("failed, rc=");
      Serial.print(client.state());
      Serial.println(" try again in 5 seconds");
      // Wait 5 seconds before retrying
      delay(5000);
    }
  }
}

void sendDhtSensor() {
  float h = dht.readHumidity();
  float t = dht.readTemperature();

  if (isnan(h) || isnan(t)) {
    Serial.println("Failed to read from DHT sensor!");
    client.publish("dhtTopic", "Failed to read from DHT sensor");
    return;
  }

  char dhtMessage[120];
  sprintf(dhtMessage, "{ \"temperature\": %d, \"humidity\": %d }", round(t), round(h));
  lastTemp = round(t);

  Serial.print("Publish message: ");
  Serial.println(dhtMessage);

  client.publish(dhtTopic, dhtMessage);
}

void sendPower(long ldrTime) {
  float watts;

  watts = 3600000 / ldrTime;

  char ldrMessage[120];
  sprintf(ldrMessage, "{ \"power\": %d }", round(watts) );
  lastPower = round(watts);

  Serial.print("Publish message: ");
  Serial.println(ldrMessage);

  client.publish(ldrTopic, ldrMessage);
}
void loop() {

  if (!client.connected()) {
    reconnect();
  }
  client.loop();

  long now = millis();

  // Send DHT sensor data every 60s
  if (now - lastDht > 60000) {
    lastDht = now;
    sendDhtSensor();
  }

  // Only read every 20ms
  //currentTime = millis();
  if ( lastLdrUpdate < ( now - 20 ) ) {
    lastLdrUpdate = now;

    // Send power data when necessary (threshold = 200)
    long ldrValue;
    ldrValue = analogRead(A0);
    if ( ldrValue > 200 ) {
      long ldrNow = millis();

      long ldrTime;
      ldrTime = ldrNow - lastLdrTime;

      // Skip double detections
      if ( ldrTime < 500 ) { return; }

      lastLdrTime = ldrNow;
      sendPower(ldrTime);
    }

  }  // lastLdrUpdate < 20ms
}
tldr; There are only a few values to change. Update the WiFi SSID, password and MQTT server name around line 13 and the MQTT username and password around line 97.
The script sets up a connection over WiFi using MQTT to the Mosquitto server. It then polls the DHT sensor every 60 seconds and sends the temperature and humidity to the MQTT server. It reads the value of the LDR every 20 ms, and if the value is higher than the threshold, calculate the wattage based on the time difference between the last pulse and the current pulse. It then publishes this value to MQTT as well.
Node-RED
Node-RED is setup to receive the data published to the topics the above Arduino code uses. It then creates a JSON object from the data, adds a timestamp for publishing to ElasticSearch and uploads the data to ES using an HTTP POST request.

Add Timestamp block
The date is published twice in the messages, which seems odd. The es_timestamp value is used as the @timestamp key in ES. The index_date value is used for auto-generating the ES index name (sensors-2016-07-25 etc) as you can see in the HTTP Block.
d = new Date();

function ISODateString(d){
    function pad(n){return n<10 ? '0'+n : n}
    return d.getUTCFullYear()+'-'
    + pad(d.getUTCMonth()+1)+'-'
    + pad(d.getUTCDate())+'T'
    + pad(d.getUTCHours())+':'
    + pad(d.getUTCMinutes())+':'
    + pad(d.getUTCSeconds()) + '.000Z'
}

function DateString(d){
    function pad(n){return n<10 ? '0'+n : n}
    return d.getUTCFullYear()+'.'
    + pad(d.getUTCMonth()+1)+'.'
    + pad(d.getUTCDate())
}

msg.payload.es_timestamp = ISODateString(d);
msg.index_date = DateString(d);
return msg;
Template block
This block generates the POST data that will be sent to Elasticsearch.
{ "@timestamp":"{{payload.es_timestamp}};", "power":{{payload.power}} }
HTTP Block
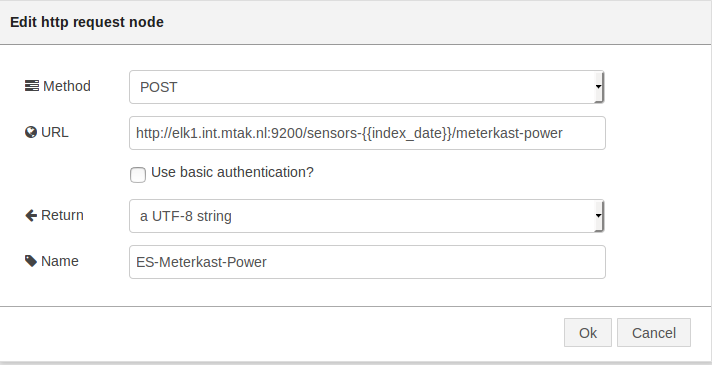
Check Elasticsearch
You can check if there is data being added to Elasticsearch with:
$ curl -XGET 'http://elasticsearch:9200/sensors-*/_search?q=_type:meterkast-power&size=20&sort=@timestamp:desc'
This query will display the last 20 entries for the power index and type.
Kibana
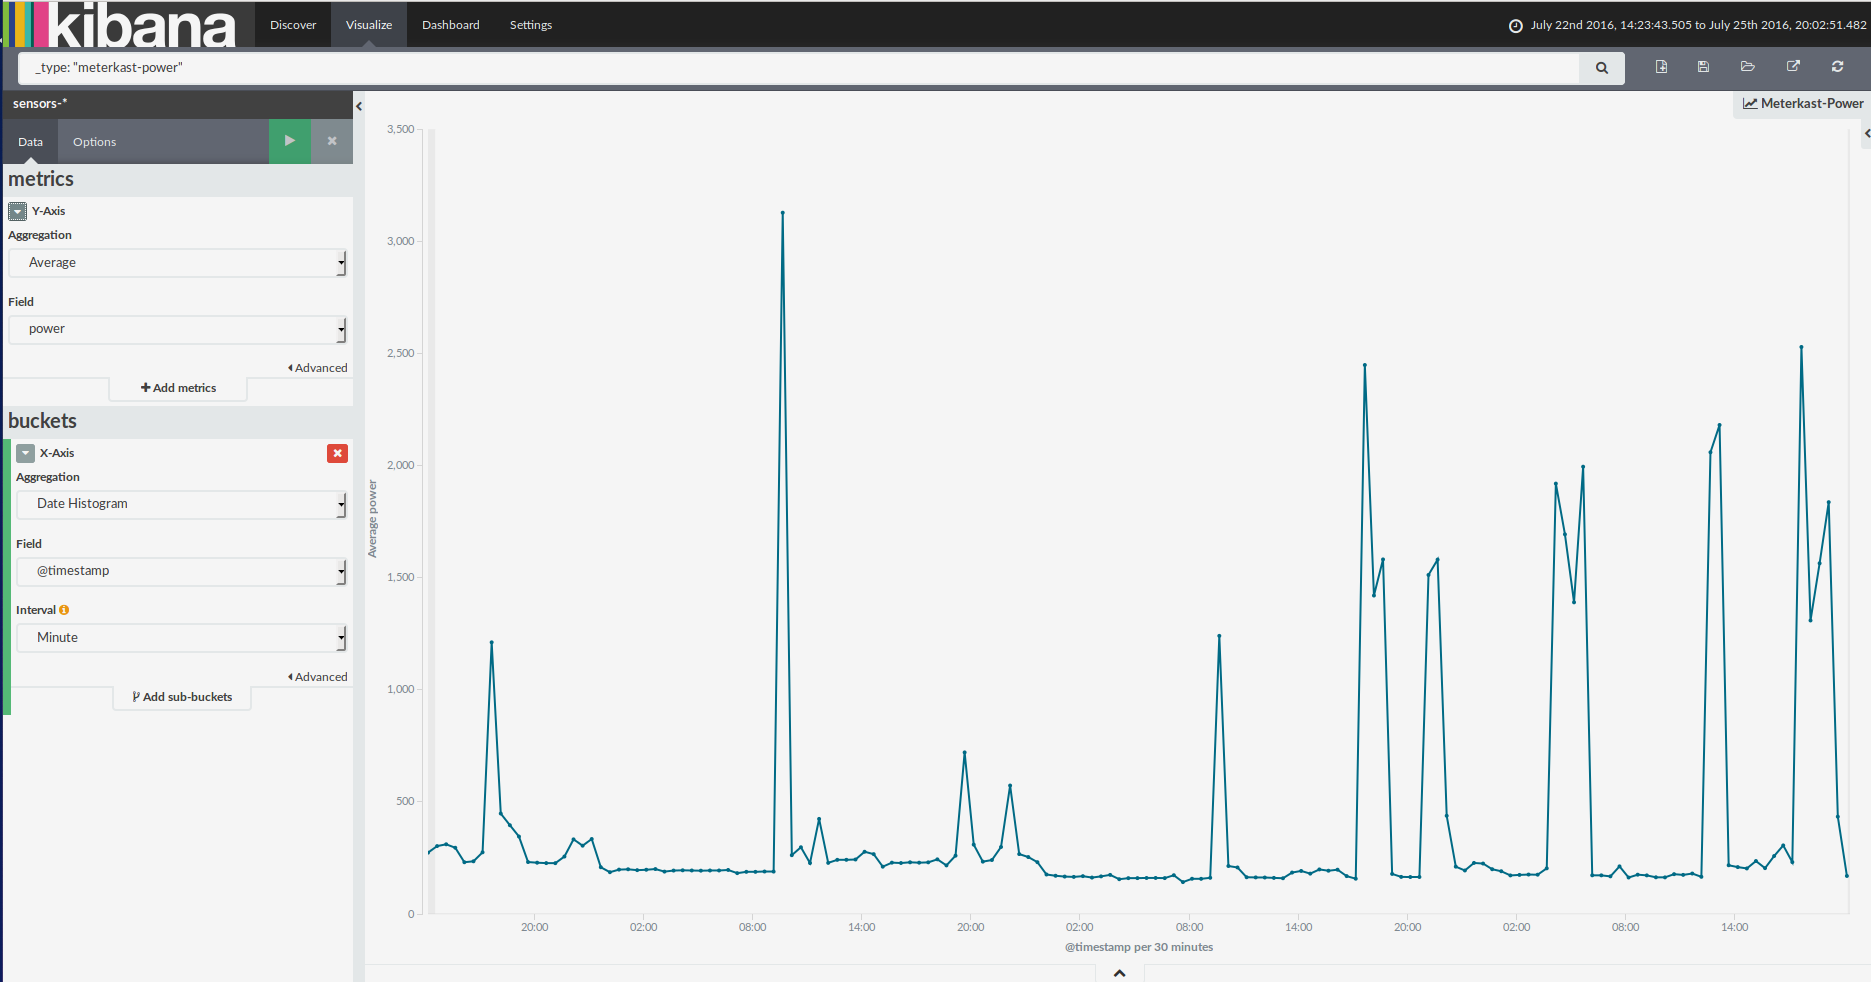
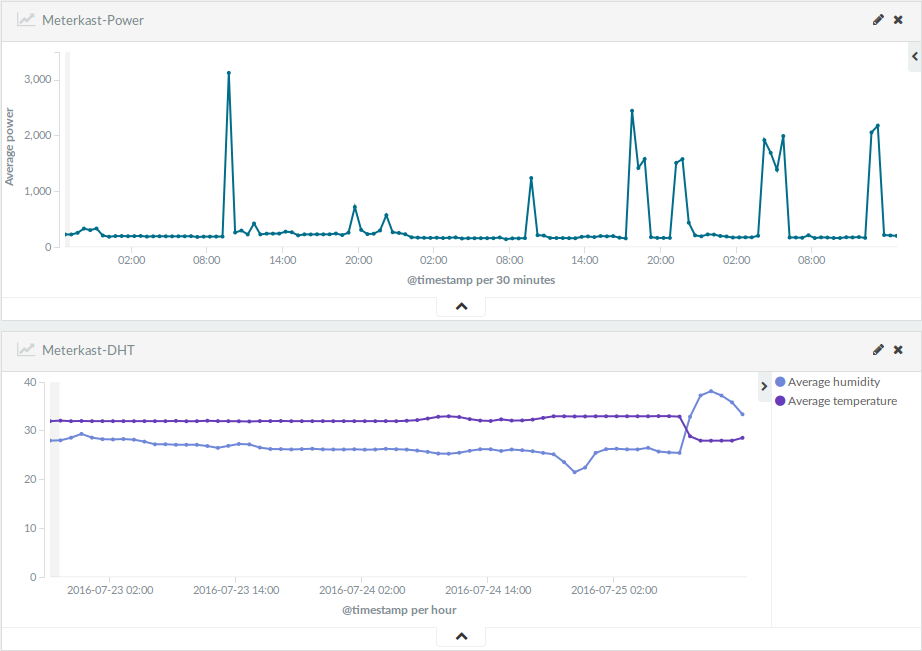
Add the index to Kibana (you can use the wildcard sensors-* form). A few examples of graphs you could make:
Gnuplot
To render images to websites, you could use the data from ES to make graphs using Gnuplot. For example, you could get the data for the last 24 hours from ES:
curl -XGET 'http://elk1.int.mtak.nl:9200/sensors-*/_search?pretty' -d '
{
  "query": {
    "filtered": {
      "query": {
        "query_string": {
          "analyze_wildcard": true,
          "query": "_type: \"meterkast-power\""
        }
      },
      "filter": {
        "bool": {
          "must": [
            {
              "query": {
                "query_string": {
                  "analyze_wildcard": true,
                  "query": "*"
                }
              }
            },
            {
              "range": {
                "@timestamp": {
                  "gte": "now-24h"
                }
              }
            }
          ],
          "must_not": []
        }
      }
    }
  },
  "size": 9999
}
' 2>/dev/null | egrep 'power|timestamp' | egrep -v 'type' | awk '{print $3}' | sed -e 'N;s/,\n/, /' -e 's/"//g'
And then plot this data using Gnuplot:
set term png size 512,181 enhanced font 'Verdana,7'
set style data fsteps
set output '/var/www/tools/api/sensor/power-24h.png'
set xdata time
set timefmt '%Y-%m-%dT%H:%M:%S.000Z'
set format x "%H"
set datafile sep ','
set title "Meterkast-Power - Last 24 hours (UTC)" font 'Verdana,9'
plot 'power-24h.dat' using 1:2 title 'Watts' with lines lt rgb "#00DD00"
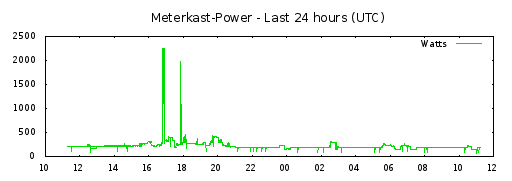
You get a graph that will look like:
